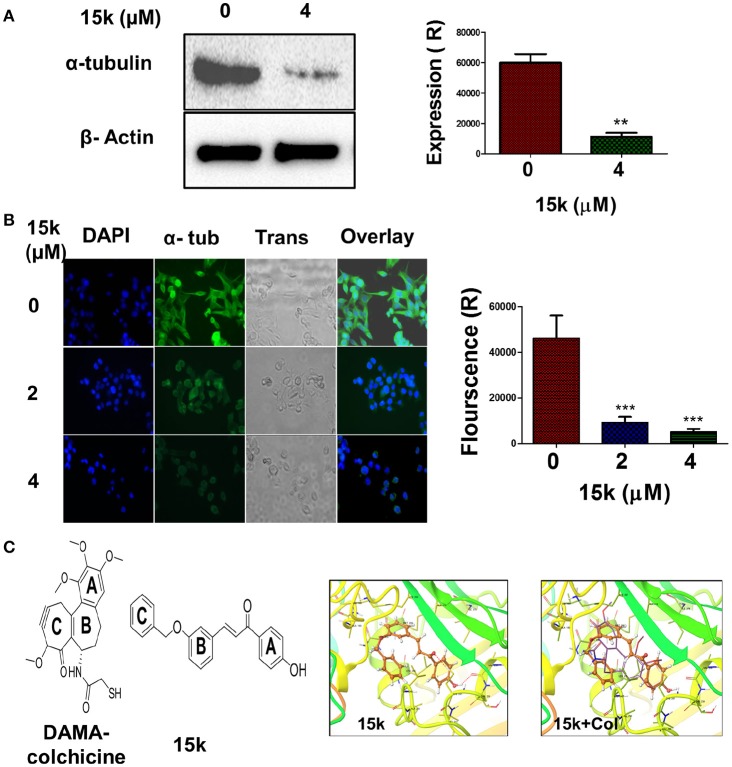
Figure 6.
The effect of 15k on the expression of α- tubulin protein level in HCT116 cells; (A) Western blot showing the protein level of α-tubulin following overnight incubation with 15k (0, 4 uM). A histogram quantitatively summarizing the results of expression is also shown where Expression R stands for relative expression; (B) The effect of 15k on spindle microtubule formation in HCT116 cells. Representative pictures of α-tubulin fluorescence from cells incubated overnight with 15k at different concentrations (0, 2, 4 μM). Cells were then fixed and labeled with a monoclonal α-tubulin (green) antibody conjugated to FITC and nuclei stained with DAPI. A histogram quantitatively summarizing the results is also shown. The data are presented as the means ± SEM of three independent studies with **p < 0.01, ***p < 0.001; (C) The docking studies with the structure of DAMA Colchicine (Col) and 15k, respectively, flowed by XP-Glide predicted binding mode of 15k in the colchicine binding site of tubulin (PDB ID: 1SA0). Important amino acids are depicted as sticks with the atoms colored as carbon—green, hydrogen—white, nitrogen—blue, oxygen—red, sulfur—yellow, whereas the ligand 15k is shown with the same color scheme as above except for carbon atoms which are represented in orange. The red dotted lines represent hydrogen bonding. An overlay of the ligand 15k on DAMA-colchicine (carbon atoms presented in yellow) in the colchicine binding site of tubulin is also shown.

