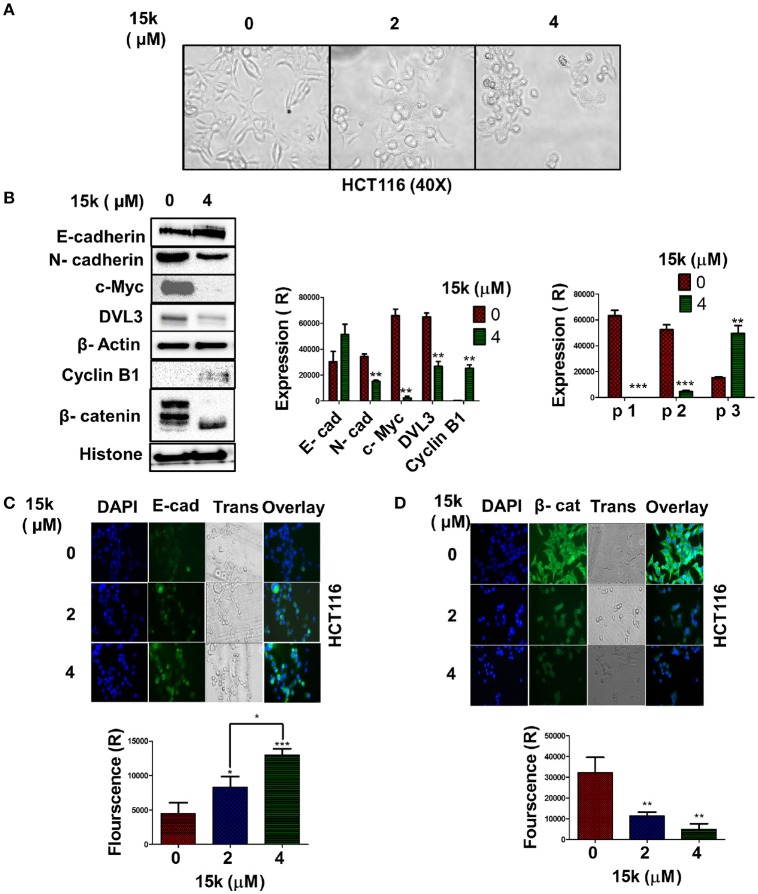
Figure 8.
The effect of 15k on embryonic signaling pathways: (A) Representative image of HCT116 cell morphology at 40X. The morphological changes are consistent with EMT inhibition as the cells where converted from a mesenchymal shape to epithelial shape. Images were taken from EVOS microscope; (B) Western blots illustrating the levels of E-cadherin, N-cadherin, DVL3, c-Myc, Cyclin B1, and β-catenin fragments following overnight incubation with 15k (4 μM). The values of the cytosolic proteins were normalized to β-actin and histone levels. A histogram quantitatively summarizing the results for each protein where expression (R) stands for the relative expression level of each protein and a histogram quantitatively summarizing the effects of 15k on the levels of the β-catenin protein fragments are both shown where P1, P2, and P3 are the fragments of β-catenin; (C,D) representative pictures of E-cadherin and β- catenin fluorescence in HCT116 cells incubated with 15k at 0, 2 or 4 μM for 24 h, respectively. Histograms quantitatively summarizing the results are shown (Fluorescence R is for relative fluorescence levels). All data are presented as the means ± SEM of three independent experiments with *p < 0.05, **p < 0.01, ***p < 0.001.

