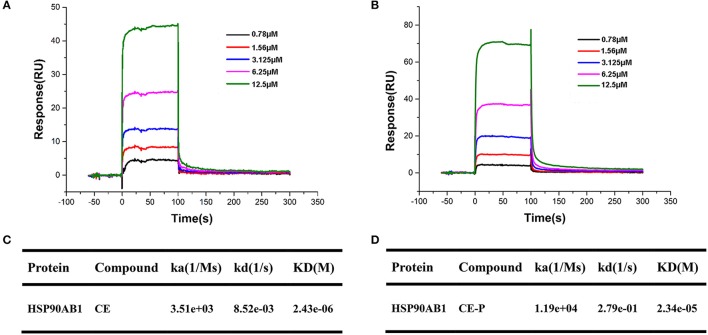
Figure 7.
SPR analyses of CE or CE-P binding to Hsp90AB1. Hsp90AB1 immobilized to a CM5 Sensor Chip was provided with the CE/CE-P at concentrations varying from 0.75 to 12.5 μM. (A,B) Representative binding curves of CE (A) and CE-P (B) binding to Hsp90AB1. (C,D) Kinetic binding constants of CE (C)/CE-P (D) with Hsp90AB1.

