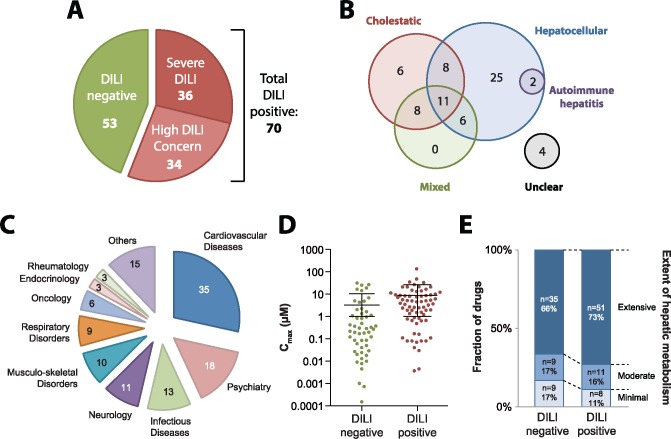
Figure 2.
Overview of the compound panel tested in this study. A, Pie chart showing the classification of 123 compounds into 70 that have been associated with DILI events in the clinic (shades of red) and 53 that have not been reported to cause clinically apparent liver injury (green). B, Venn-diagram visualizing the reported DILI patterns for the 70 DILI positive compounds. C, Pie chart depicting the distribution of the 123 tested compounds across therapeutic areas. D, Therapeutic cmax serum concentrations of DILI positive and DILI negative medications are overall similar. E, Most drugs tested in this study are extensively metabolized by the liver. Overall, the DILI negative compounds show a slight tendency for less hepatic metabolism compared with DILI positive drugs.

