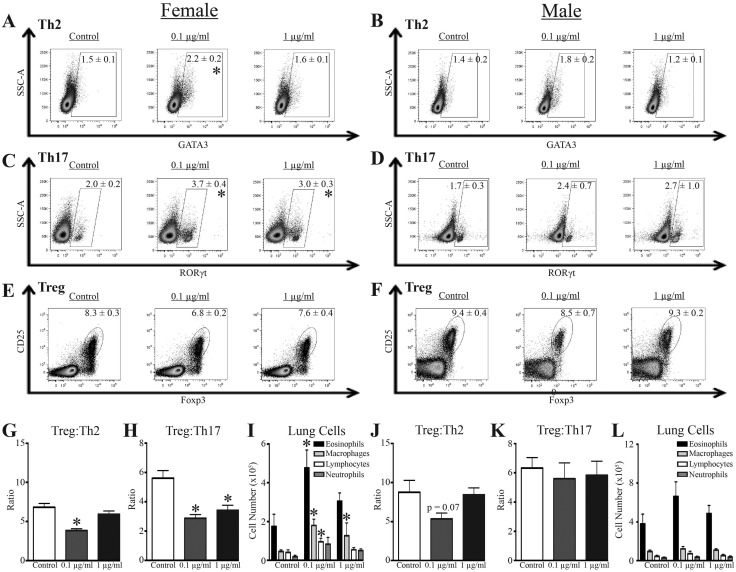
Figure 2.
Immunological effects of developmental exposure in a model of allergic airway disease. At maturity (6–8 weeks of age), 9–10 female and 9–10 male offspring from each developmental exposure group were sensitized and challenged with HDM. Within each group, offspring of the same sex were from different dams. A–F, Representative dot plots from flow cytometric analyses of CD4+ T cell subsets from MLN 48 h after HDM challenge, and mean percentages ± SEM are depicted according to sex and treatment group for Th2 cells (A–B, GATA3+CD4+ T cells), Th17 cells (C–D, RORγt+CD4+ T cells), and Tregs (E–F, Foxp3+CD25+CD4+ T cells). All dot plots are gated on CD4+ T cells. G–H, Mean ratio (±SEM) of Treg:Th2 cells and Treg:Th17 cells in MLN from female offspring. I, Mean number (±SEM) of eosinophils, macrophages, lymphocytes, and neutrophils in BAL from female offspring. J–K, Mean ratio (±SEM) of Treg:Th2 cells and Treg:Th17 cells in MLN from male offspring. L, Mean number (±SEM) of eosinophils, macrophages, lymphocytes, and neutrophils in BAL from male offspring. An * represents a p-value ≤ .05 compared with same sex control.

