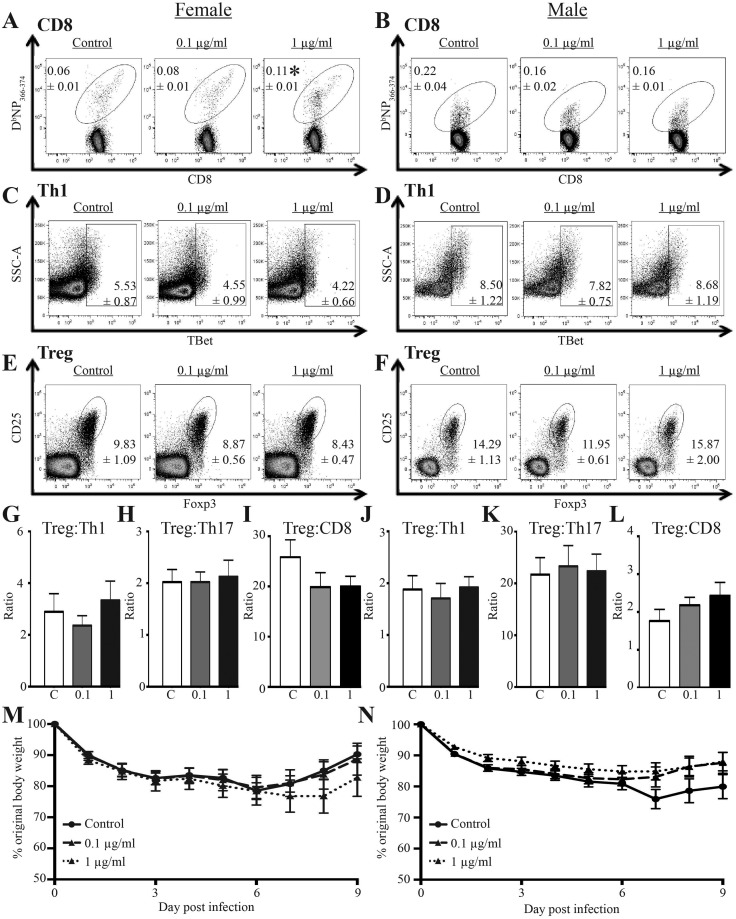
Figure 3.
Effects of developmental exposure to chemicals associated with UOG on T cells and body weight change after viral infection. At maturity (6–8 weeks of age), 9–10 female and 9–10 male offspring from each exposure group infected with IAV. Within each group, offspring of the same sex were from different dams. A–F, Representative dot plots depict flow cytometric analyses of T cell subsets from MLN 9 days after infection: IAV NP-specific CD8+ T cells (A–B, DbNP366-375+CD8+ T cells, gated on CD3+CD8+ cells), Th1 cells (C–D, TBet+CD4+ cells, gated on CD3+CD4+ cells), and Tregs (E–F, Foxp3+CD25+CD4+ cells; gated on CD3+CD4+ cells). The mean percentages (±SEM) of the indicated T cell sub-types in each exposure group and for both sexes are denoted on the plots. G–L, The mean ratios (±SEM) for Treg:Th1 cells, Treg:Th17 cells, and Treg:NP-specific CD8+ T cells for each exposure group and separated by sex. M–N, Mean (±SEM) body weight change following infection for female (M) and male (N) offspring. An * represents a p-value ≤ .05 compared with sex matched offspring of control dams.

