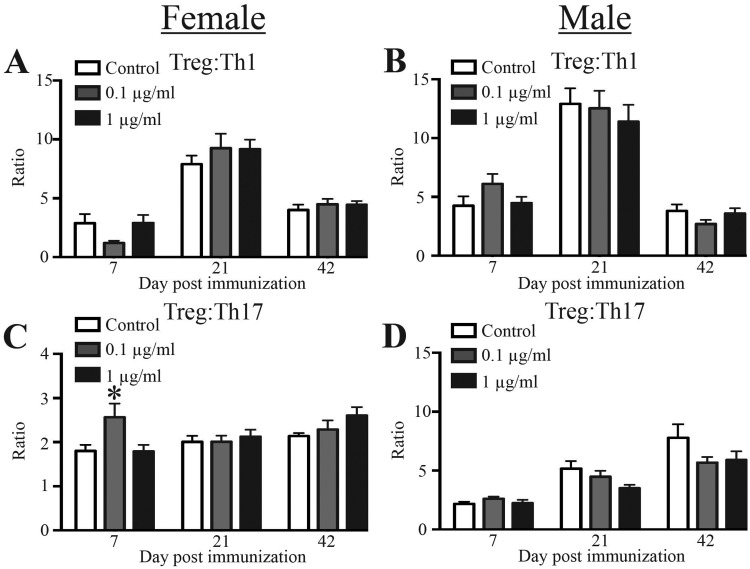
Figure 4.
CD4+ T cell subset proportions during EAE disease progression. Twenty-six adult (6–8 weeks of age) female and male offspring from each exposure group were immunized with a CFA/MOG35–55 emulsion to induce EAE. To enumerate CD4+ T cells in cervical lymph nodes, 8–10 female and 8–10 male mice from each group were sacrificed 7, 21, or 42 days after immunization. Mice were randomly assigned to each time point. A–D, The bar graphs depict the mean Treg:Th1 ratios (A–B) and mean Treg:Th17 ratios (±SEM) (C–D). Same sex offspring at each timepoint are from different dams. An * represents a p-value ≤ .05 compared with same sex control on the same day post immunization.

