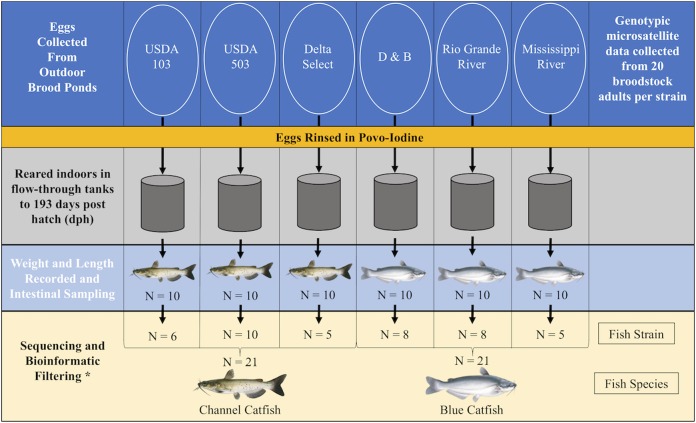
FIGURE 1.
Schematic outlining the design of the study and the sample size throughout each step. Samples were required to contain 10,000 classified SVs for inclusion in the downstream analysis, explaining the reduction in sample size at the bioinformatic filtering step (∗). Images © Joseph R. Tomelleri.

