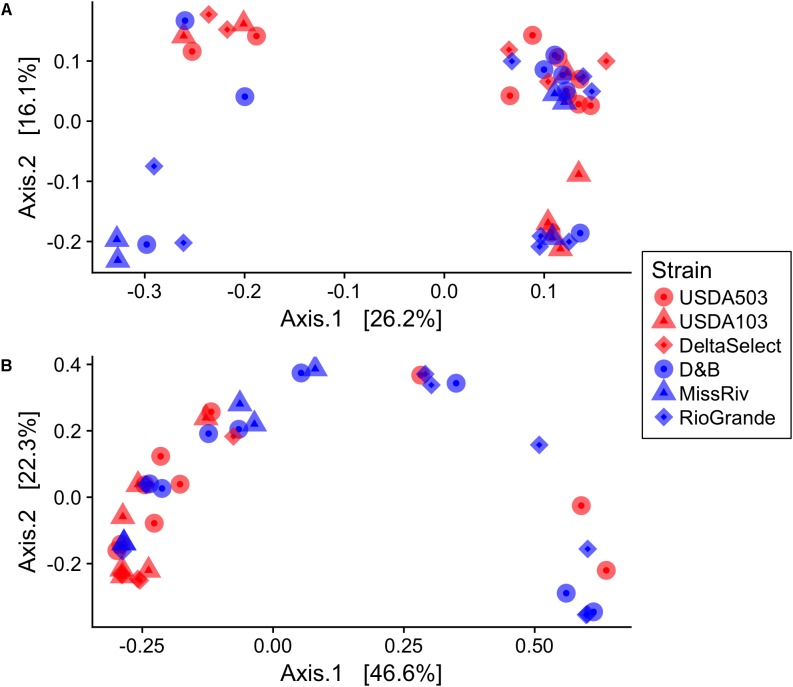
FIGURE 3.
Principal coordinates analysis (PCoA) plots of the gut microbiota beta-diversity of blue catfish I. furcatus (blue) and channel catfish I. punctatus (red) using (A) unweighted UniFrac (B) weighted UniFrac. Shapes correspond to the specific fish strains nested within the two ictalurid species. Data were rarefied at the minimum library size (11,631 SVs) prior to beta-diversity analysis.

