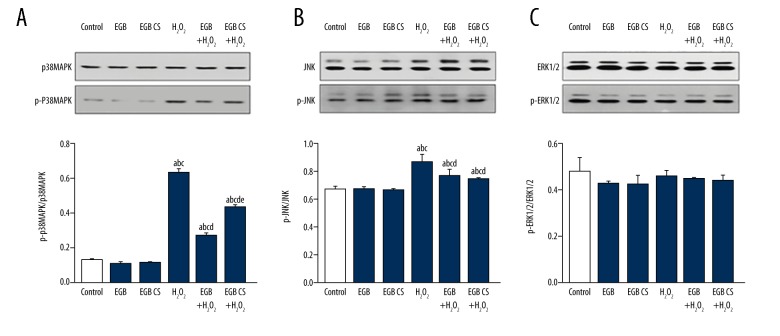
Figure 7.
Effects of EGB or EGB CS on MAPK signaling pathways in BMSCs. Western blot analysis of p38MAPK, p-p38MAPK, JNK, p-JNK, ERK1/2 and p-ERK1/2. Quantitative analysis of p-p38MAPK/ p38MAPK, p-JNK/JNK, and p-ERK1/2 /ERK1/2 relative level. All data are presented as mean value ±SD and n=3 in each group. a) p<0.05, significantly different from control; b) p<0.05, significantly different from EGB; c) p<0.05, significantly different from EGB CS; d) p<0.05, significantly different from H2O2; e) p<0.05, significantly different from EGB +H2O2. One-way ANOVA.

