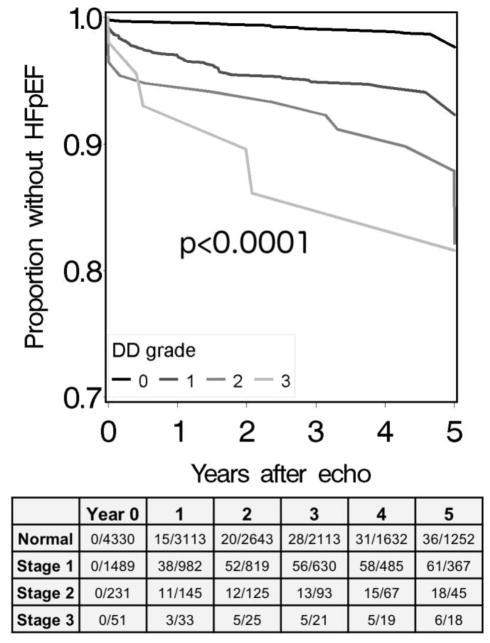
Figure 3. Kaplan-Meier curves, stratified by DD stage, showing time to an incident clinical diagnosis of HFpEF.
Subjects with any clinical heart failure diagnosis prior to the echocardiogram were excluded. The table shows the cumulative counts of HFpEF diagnoses and of subjects remaining at each year. Data were censored at 5 years. The p-value is based on a log-rank test statistic.

