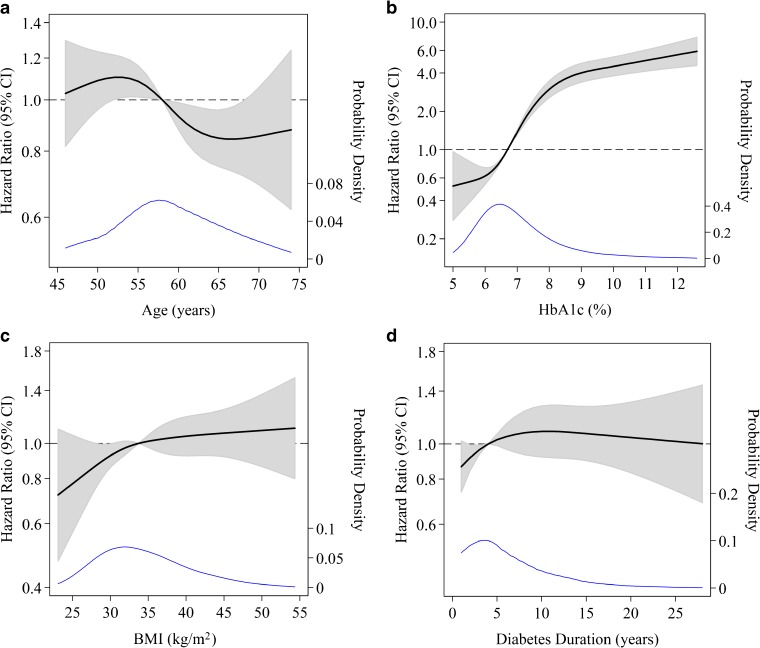
Figure 1.
Adjusted hazard ratios for insulin initiation by continuous patient characteristics using restricted cubic spline models. Continuous predictors are baseline age (Panel A), hemoglobin A1c (HbA1c) (Panel B), body mass index (BMI) (Panel C), and baseline diabetes duration (Panel D). Hazard ratios (displayed as heavy black lines) are expressed relative to the median of the predictor, with four knots determined by Harrell’s method;19 gray shaded areas represent 95% confidence intervals. Kernel density plots depicting the distribution of the predictor are overlaid (thin blue lines), with probability density labeled on the right axis; plots are truncated at the 0.5th and 99.5th percentiles of the distribution of the predictor. All hazard ratios are fully adjusted (model 3).

