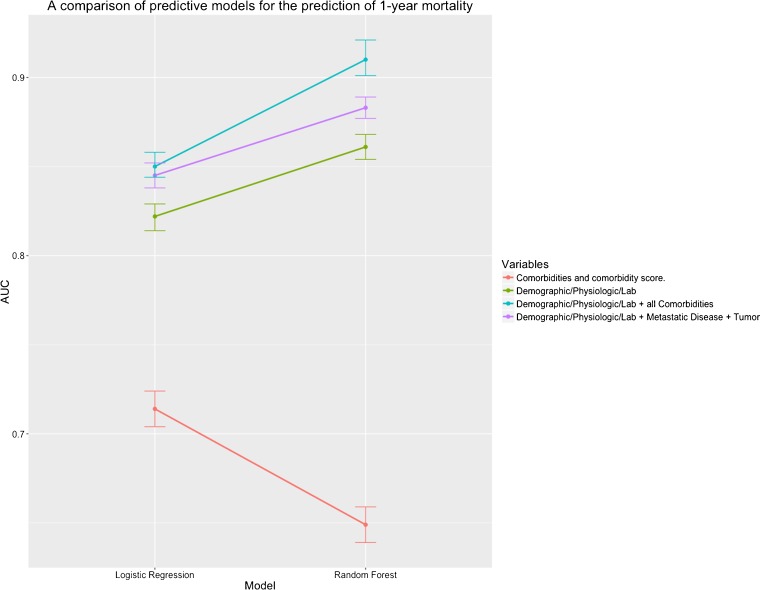
Figure 1.
Line chart of model AUCs for predicting 1-year mortality. The AUC of each model on the validation data set is plotted on the vertical (y-axis) and the model type is indicated on the horizontal (x-axis). The variables incorporated into each model are listed in the color-coded legend on the right hand side of the figure. The vertical error bars show the 95% confidence intervals around each AUC estimate. Each point represents the AUC of one model.

