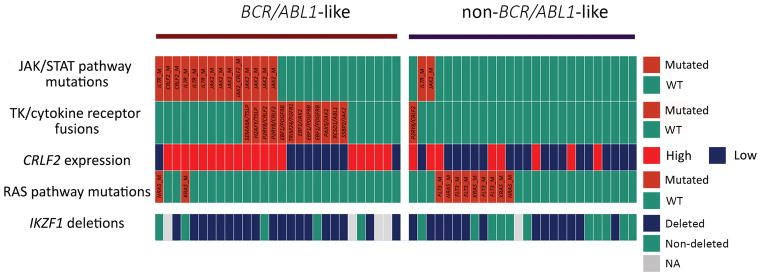
Figure 1.
Distribution of BCR/ABL1-like specific genetic lesions in the samples with a complete molecular characterization. Legend: green boxes for JAK/STAT pathway mutations: wild-type; red boxes: mutation detected. The mutated gene name is provided in the figure; green boxes for RAS pathway mutations: wild-type; red boxes: mutation detected; the mutated gene name is provided in the figure; CRLF2 expression; red boxes: overexpression; TK/cytokine fusions: green boxes: no rearrangement detected; red boxes: rearrangement detected. The fusion gene is specified in the figure; IKZF1 deletions: green boxes: no deletions; blue boxes: presence of deletions; grey boxes: sample not evaluated.

