
Figure 2.
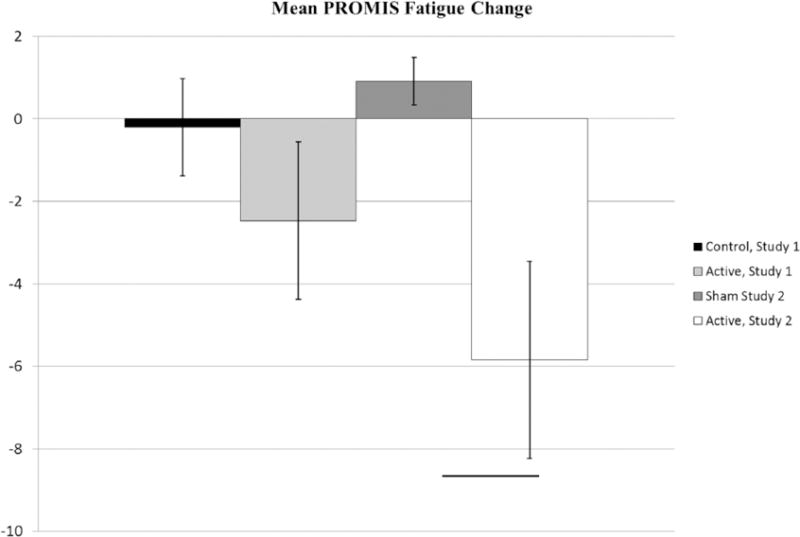
Mean change in PROMIS Fatigue score is shown. Error bars represent standard error of the mean.
*significance at p < 0.05 as determined by a two sample t-test.
Official websites use .gov
A
.gov website belongs to an official
government organization in the United States.
Secure .gov websites use HTTPS
A lock (
) or https:// means you've safely
connected to the .gov website. Share sensitive
information only on official, secure websites.
Mean change in PROMIS Fatigue score is shown. Error bars represent standard error of the mean.
*significance at p < 0.05 as determined by a two sample t-test.