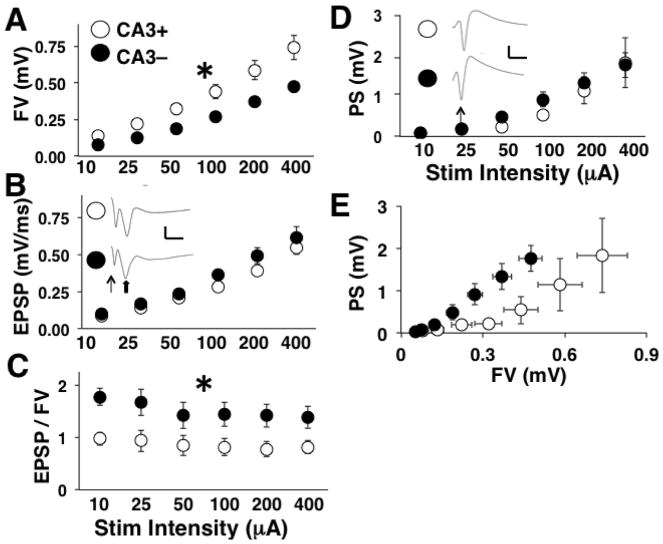
Figure 2.
Schaffer collateral I/O curve results. For all panels, CA3+ denotes the slices with CA3 intact and CA3- denotes the slices with CA3 removed. A) Mean FV amplitude at each stimulation level. Mean values are based on 16 slices (7 animals) for CA3+ and 17 slices (7 animals) for CA3-. B) Mean fEPSP slope at each stimulation level. Insets show averaged waveforms of all sweeps at the highest stimulation level for CA3+ and CA3- slices. Scale bars are 1 mV and 10 ms. Line arrow points to the FV. Block arrow points to the fEPSP. C) Mean fEPSP to FV ratios at each stimulation level. D) Mean PS amplitude at each stimulation level. * indicate a significant main effect of CA3 removal at p < 0.05. Insets show averaged waveforms of all sweeps at the highest stimulation level for CA3+ and CA3- slices. Scale bars are 1 mV and 10 ms. Line arrow points to the FV.

