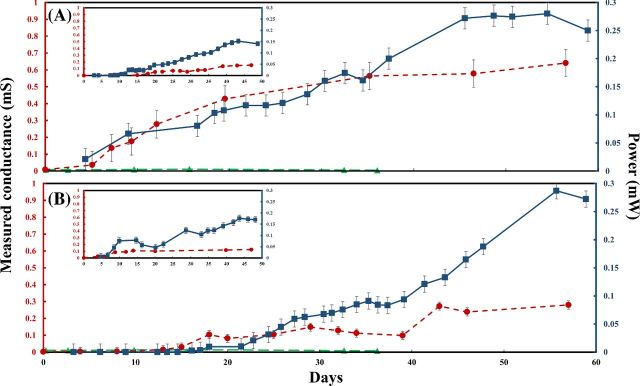
Figure 2.
Measured conductance and power of MFCs over time (A) from MFCs with 300 μm non-conductive gap and (B) from MFCs with 1000 μm non-conductive gap. Inserts: measured conductance and power of SA-MFCs over time. Red dash line represents the measured conductance and blue solid line represents the power. Error bars indicate the standard error of individual measurements of several MFCs (n = 3).

