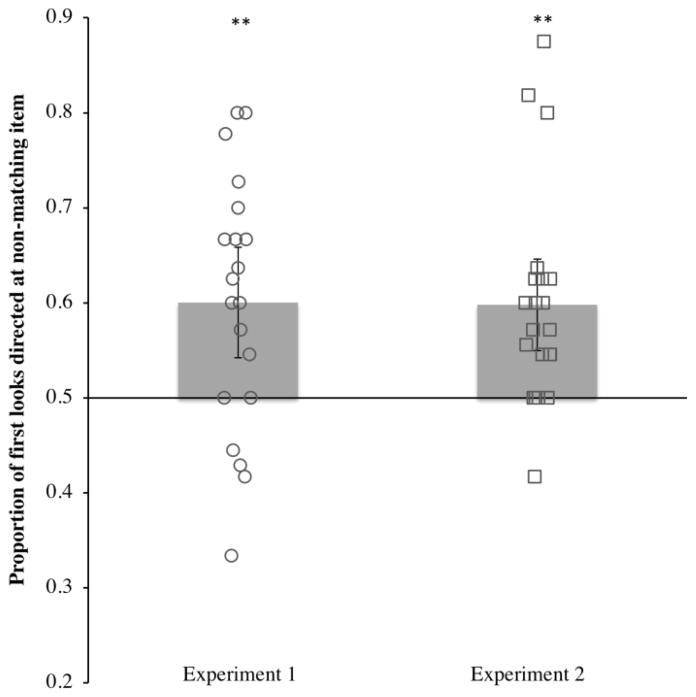
Figure 2.
Proportion of first looks directed at the non-matching item during the test phase by Experiment. Mean proportions are indicated by bar height, and 95% confidence intervals are indicated by the error bars. Each open shape represents an individual infants’ proportion. Means that differed significantly from chance (.50) are indicated by **, p < .01.

