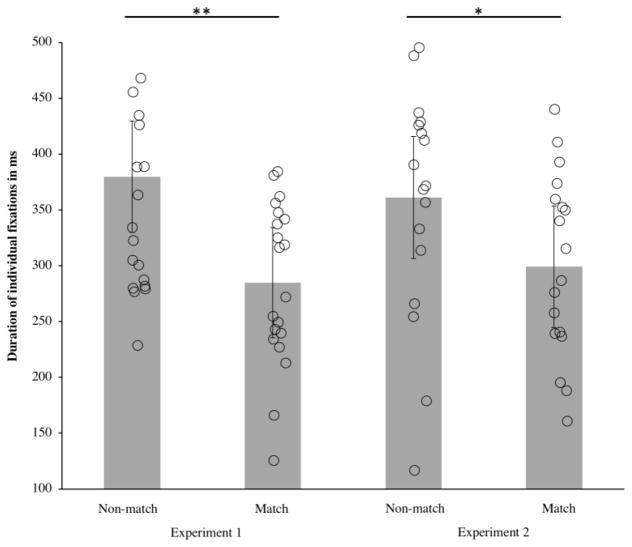
Figure 4.
Average duration of individual fixations to the non-matching and matching items in Experiment 1 (left) and Experiment 2 (right). Mean looking time (averaged across infants) is represented by the height of the bar, and the error bars represent 95% confidence intervals; the average for each individual infant is represented by an open shape. For both experiments, individual fixations to the non-matching item were significantly longer than individual fixations to the matching item, ** p ≤ .01, * p ≤ .05.

