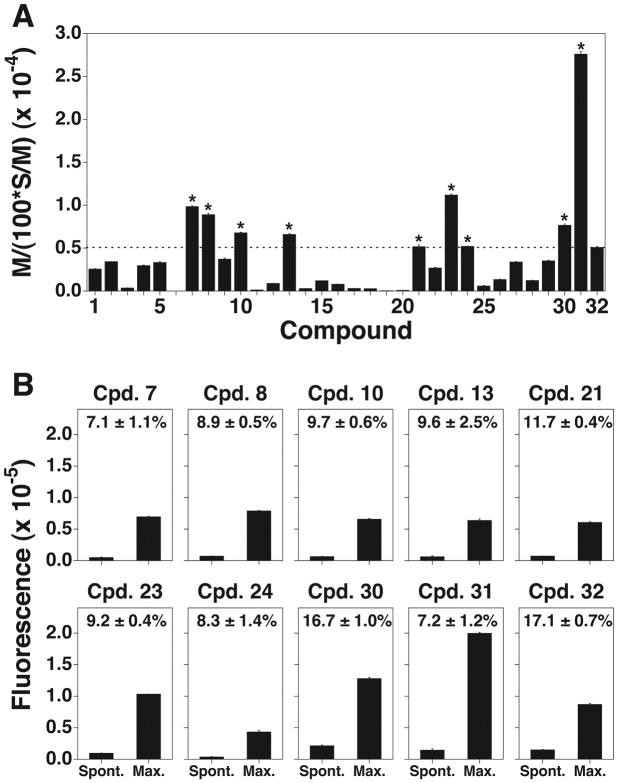
Figure 1.
Live cell labeling with novel terpyridine derivative proligands. (A) Selection of proligands with a high maximum release and a low spontaneous release rate (%). U937 histocytoma cells were treated with a series of newly synthesized terpyridine proligands, and the index M/[(100 × S)/M] was determined for each compound. The index of 32 was 5091±96 (mean ± SD) and indicated as a dotted line. Compounds with the values greater than 5091±96 were indicated with asterisk. (B) Comparison of the spontaneous release rates of the compounds with the M/[(100 × S)/M] values being greater than that of 32. U937 cells were treated with compounds with the M/[(100 × S)/M] values greater than 5091±96. The spontaneous release and the maximum release values of each compound are depicted as bar graphs and the spontaneous release rates (%, mean ± SD) are indicated in the graphs. All experiments were performed in triplicate.

