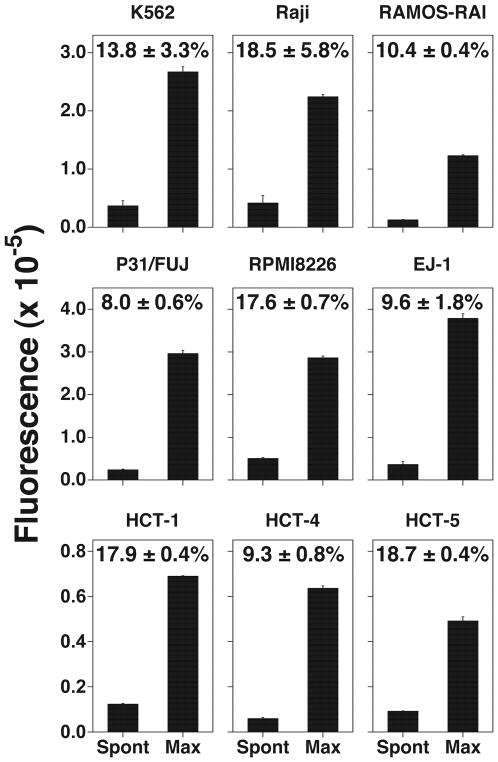
Figure 2.
Live cell labeling with the compound 31. Tumor cell lines and HTLV-1-transformed cell lines were treated with 31. The spontaneous release and the maximum release values for the cell lines are depicted as bar graphs and the spontaneous release rates (%, mean ± SD) are indicated in the graphs. All experiments were performed in triplicate.

