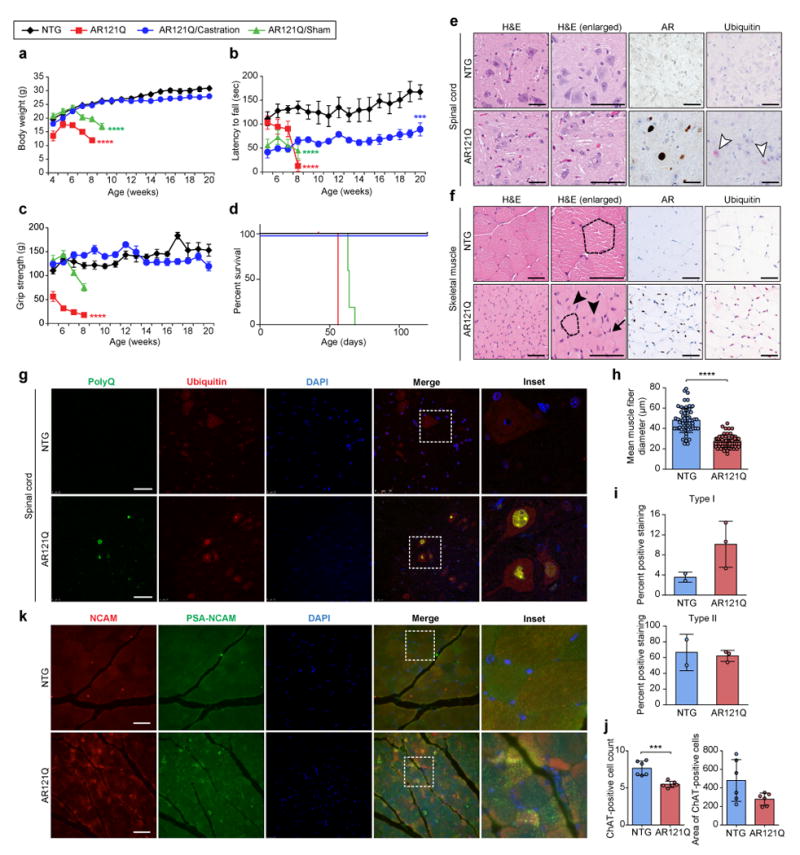
Figure 2. AR121Q-expressing mice recapitulate SBMA symptoms and pathology.

(a-d) Phenotypic measures of SBMA degeneration (mean body weight (a), mean rotarod activity (b), mean grip strength (c), and survival (d) of NTG (black diamonds) and AR121Q mice (red squares), in addition to sham-operated (green triangles) and castrated (blue circles) AR121Q mice. n = 5 mice per group, ****P ≤ 0.0001, ***P =0.0007 by two-way ANOVA and Dunnett’s posthoc test compared to the NTG group (a-c) or Kaplan-Meier estimation (log-rank test) (d). Note that the abrupt reduction in survival reflects animal protocol criteria that mandate euthanasia of animals with loss of 10% body weight or the development of substantial weakness. (e-f) Representative spinal cord (e) and skeletal muscle (f) sections from 7-week-old NTG and AR121Q mice from one independent experiment. Sections were stained with hematoxylin and eosin (H&E) stain for assessment of morphology, in addition to AR (N20) and ubiquitin antibodies. White arrowheads indicate ubiquitin-positive nuclear inclusions in the spinal cord. Dotted lines trace around representative myofibers, demonstrating differences in myofiber size. Arrow indicates atrophied myofibers. Arrowheads indicate myofibers containing centralized nuclei. (g) PolyQ (5TF1-1C2) and ubiquitin costaining in spinal cord of NTG and AR121Q mice. Representative images are shown from one independent experiment. (h-j) Quantification of the mean muscle fiber diameter of gastrocnemius/soleus myofibers (h), mean type I and type II hindlimb muscle fiber staining (i), and ChAT-positive motor neuron count and area in the anterior horn of the thoracic spinal cord (j) of NTG and AR121Q mice. Data shown in h-j were evaluated by unpaired t-test, two-tailed. n = 30 muscle fibers per mouse and 2 mice per genotype, ****P ≤ 0.0001 (h), n=2 and 3 mice for NTG and AR121Q (i), n = 3 slides per mouse (neuron count), n = 6 sections per mouse (neuron area), 2 mice per genotype were counted, ***P =0.0005 (j). (k) Immunofluorescence with antibodies against NCAM and PSA-NCAM in skeletal muscle tissues of NTG and AR121Q mice. Representative images are shown from one independent experiment. Scale bars represent 50 μm. All graphs represent mean ± s.e.m.
