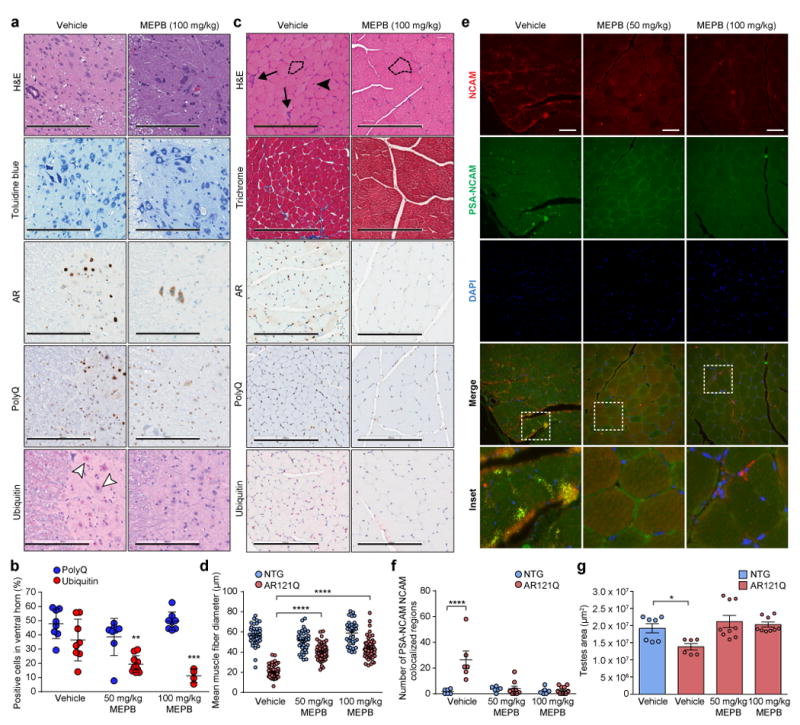
Figure 5. MEPB reduces degeneration in spinal cord and skeletal muscle of SBMA mice.

(a) Representative spinal cord sections from AR121Q mice treated with vehicle (1% DMSO in corn oil) or high-dose MEPB (100 mg/kg, three times per week) from one independent experiment. Sections were stained with H&E and toluidine blue to assess spinal cord morphology. Sections were also stained with AR (N20), polyQ (5TF1-1C2), and ubiquitin antibodies. White arrowheads indicate ubiquitin-positive nuclear inclusions. Scale bars represent 200 μm. (b) Quantification of the mean relative number of cells in the spinal cord ventral horn containing positive polyQ (blue) or ubiquitin (red) staining in AR121Q mice. Quantification was performed from total 8 fields for polyQ staining, 8 (vehicle), 10 (50 mg/kg MEPB), and 4 (100 mg/kg MEPB) fields for ubiquitin staining, 2-4 mice per treatment group, **P =0.0022, ***P =0.0005 by two-way ANOVA followed by Dunnett’s posthoc analysis for pairwise comparisons between each MEPB treatment group and vehicle. (c) Representative skeletal muscle (gastrocnemius/soleus) sections from AR121Q mice treated with either vehicle or high-dose MEPB from one independent experiment. Sections were stained with H&E and Gomori trichrome to evaluate morphology, in addition to AR, polyQ, and ubiquitin antibodies. Dotted lines trace around representative myofibers, demonstrating differences in myofiber size. Arrows indicate atrophied myofibers. Arrowhead indicates myofibers containing centralized nuclei. Scale bars represent 200 μm. (d) Quantification of the mean muscle fiber diameter of gastrocnemius/soleus myofibers of NTG (gray) and AR121Q mice (black). Quantification was performed from 20 muscle fibers per mouse, 2 (NTG) and 3 (AR121Q) mice per treatment group, ****P ≤ 0.0001 by two-way ANOVA followed by Dunnett’s posthoc analysis for pairwise comparisons between each MEPB treatment group and vehicle. Quantification was performed from 2–4 fields/mouse, 3 mice/treatment group. (e) Representative images of skeletal muscle stained with antibodies against NCAM and PSA-NCAM in AR121Q mice treated with vehicle (1% DMSO in corn oil), low-dose MEPB (50 mg/kg, three times per week), or high-dose MEPB (100 mg/kg, three times per week). Scale bars represent 50 μm. (f) Quantification of PSA-NCAM/NCAM colocalized regions. n = 6 fields for all NTG groups, 6, 9, and 10 fields for vehicle, 50 mg/kg, and 100 mg/kg MEPB treated AR121Q group, 2 mice for all NTG and vehicle treated AR121Q groups, 3 mice for 50 mg/kg and 100 mg/kg MEPB treated AR121Q groups, ****P ≤ 0.0001 by two-way ANOVA followed by Dunnett’s posthoc analysis for pairwise comparisons between each MEPB treatment group and vehicle. (g) The area of testis were measured in n = 7, 6, 9, and 9 sections from n=2, 2, 3, and 3 mice for vehicle treated NTG, vehicle, 50 mg/kg, and 100 mg/kg MEPB treated AR121Q group, respectively. Data were evaluated by one-way ANOVA followed by Dunnett’s posthoc analysis for comparison between each AR121Q treatment group and NTG vehicle. *P =0.0342. All graphs represent mean ± s.e.m.
