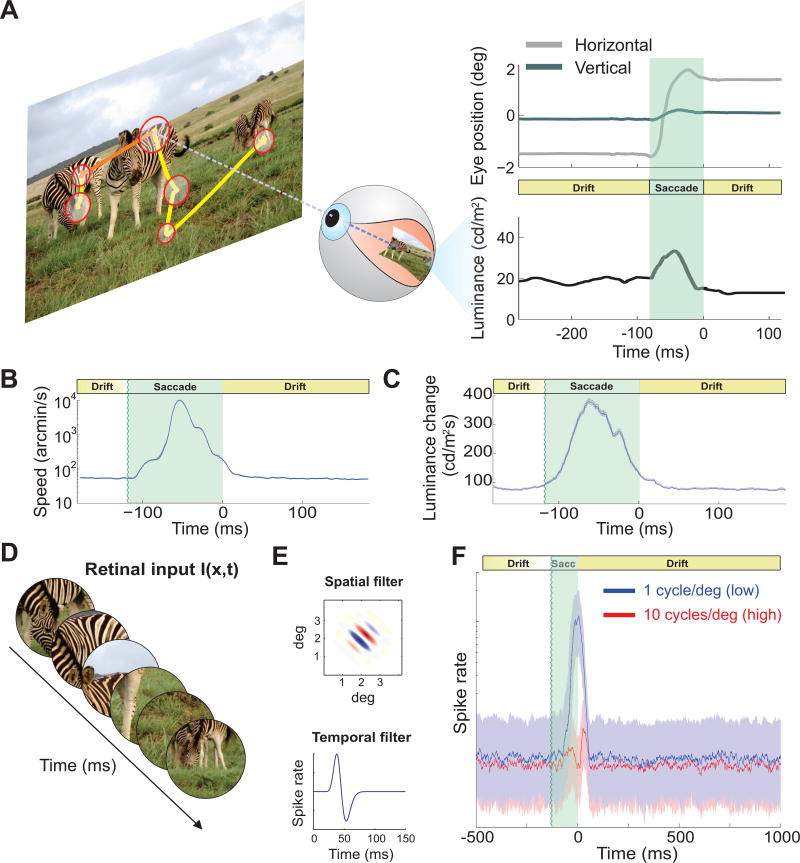
Figure 1. Natural input to the retina and predicted neural dynamics.
(A) Normal alternation between saccades (yellow segments) and periods of fixational eye movements (red circles) during viewing of natural scenes (image size: 17° × 12. 8°). The size of each circle represents fixation duration. A portion of the eye movement trace (orange) is expanded on the right panel (top), together with the luminance signal experienced by a retinal receptor (bottom). Eye movements continually modulate the input flow onto the retina, effectively redistributing spatial information in the joint space-time domain. (B) Mean instantaneous speed of the retinal image (note log scale) and (C) mean rate of change in the input luminance experienced by a foveal receptor during a fixation-saccade-fixation sequence. Time zero marks saccade end. (D–F) Neural modeling. (D) The responses of model V1 simple cells were simulated as their receptive fields moved following recorded oculomotor traces. (E) Models consisted of rectified filters with separable spatial (top) and temporal (bottom) kernels. (F) Responses of neurons tuned to low (1 cycles/deg, blue line) and high spatial frequency (10 cycles/deg, red line). Solid lines represent medians of activity. Shaded regions enclose the range between the first and third quartile.

