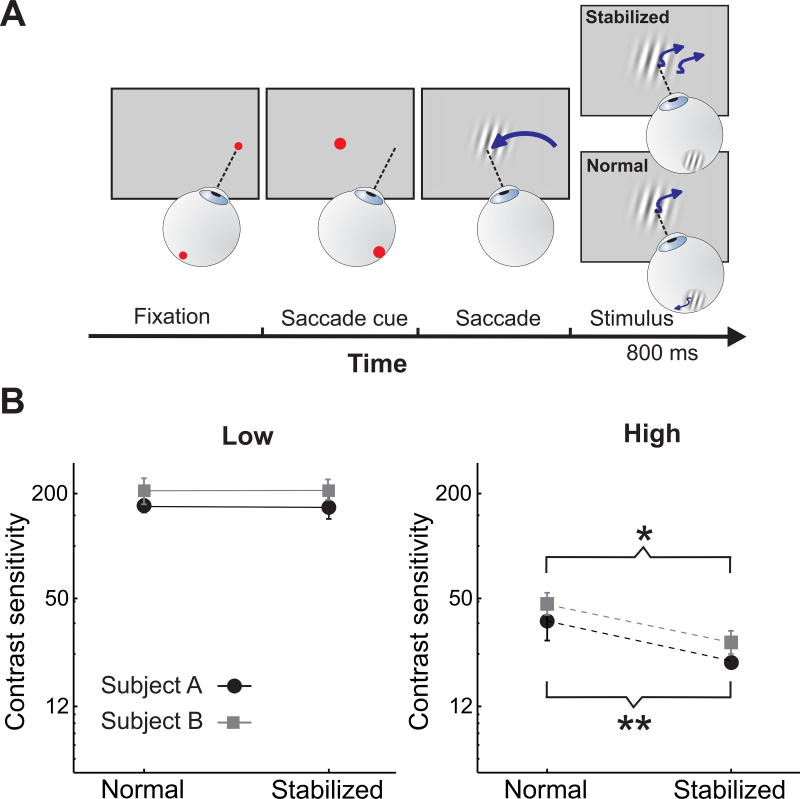
Figure 5. Perceptual consequence of fixational drift.
(A) Experimental procedure. Following the initial saccade, stimuli were either displayed at a fixed location on the monitor (Normal) or at a fixed location on the retina (Stabilized). In this latter condition, stimuli moved on the screen under real-time control to compensate for the subject’s eye movements. (B) Experimental results. Contrast sensitivity in the two viewing conditions at 1 (low) and 10 cycles/deg (high). Eliminating drift modulations impairs sensitivity at high (left panel), but not low (right panel), spatial frequencies. Each graph shows data from two observers. Error bars represent 95% confidence intervals. (*) p = 0.0035; (**) p=0.0005; parametric bootstrap test.

