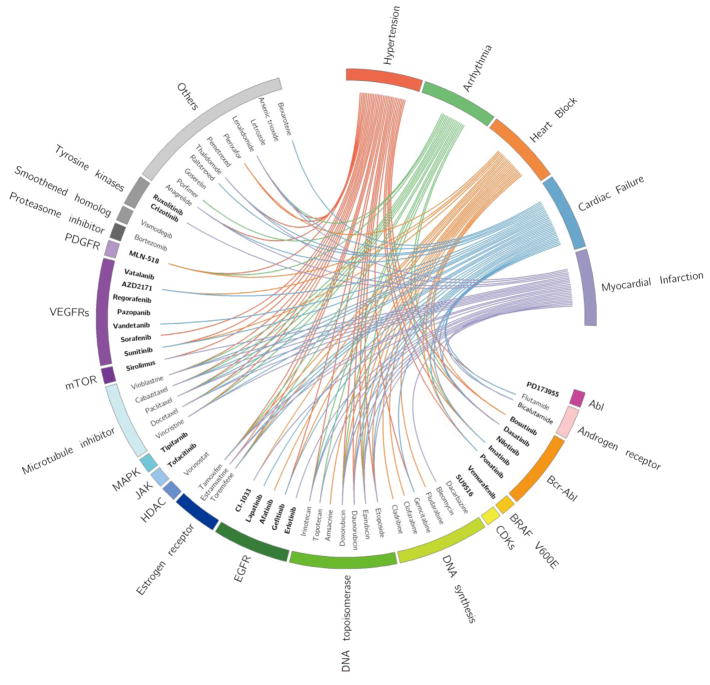
Figure 6.
Circos plot representing the predicted associations between 63 anticancer drugs and the five types of cardiovascular complications. The predicted associations with positively predicted probabilities higher than 0.8 from the combined classifiers are connected lines. Drugs are grouped based on their target families using annotation from DrugBank database.23 Kinase inhibitors are highlighted in bold font. Circos plot was drawn using Circos (v0.69).69

