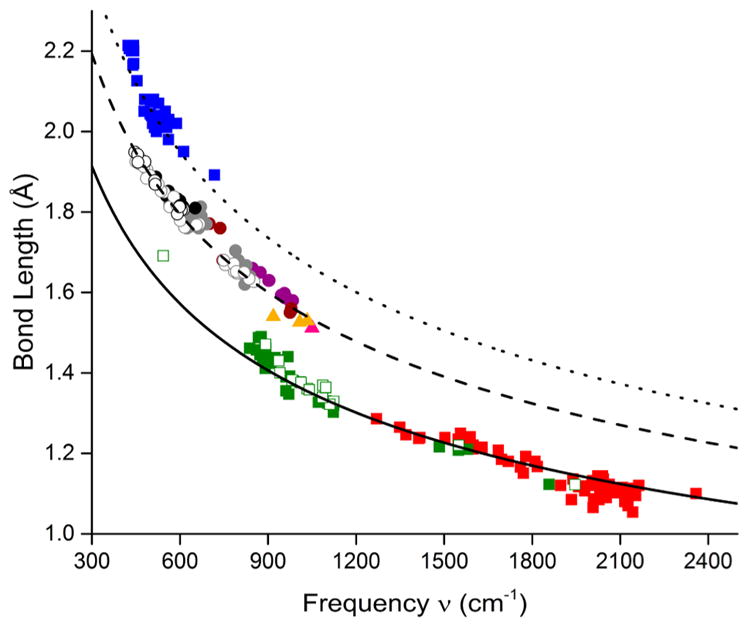
Figure 4.

Bond length vs frequency (ν) plot (same as in Figure 3a) fit to eq 6 using different values of the average reduced mass (μ). The solid line has μ = 7.5, the average reduced mass of O–O and N–N; the dashed line has μ = 12, the average of all M–N/O (listed in Table S1); the dotted line has μ = 16, the value for S–S.
