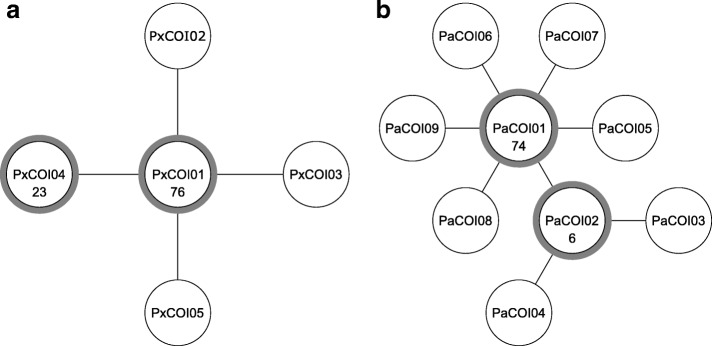
Fig. 3.
Mitochondrial DNA haplotype network for aP. xylostella (n=102,44 from this study, 58 from [16]) and bP. australiana (n=87, 37 from this study, 50 from [16]) individuals from Australia based on a 613 bp COI sequence alignment. Haplotypes shared by more than one individual are shown in circles with a grey border with the number of individuals indicated inside the circle. Haplotypes connected by a line differ by a single mutation

