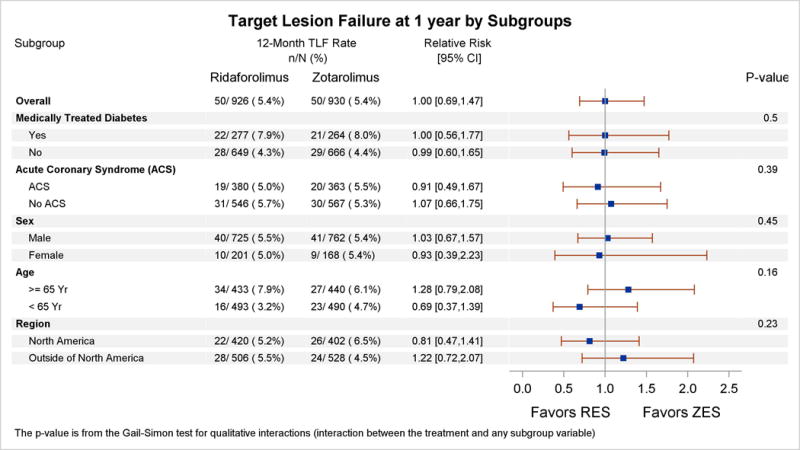
Figure 3. Subgroup analysis for the primary end point of target lesion failure at 1-year follow-up.

Subgroup analysis for prespecified baseline characteristics is shown. The P value for qualitative interaction (treatment by subgroup) is obtained from the Gail-Simon test, which assesses the heterogeneity of the treatment effect across subgroups. ACS indicates acute coronary syndrome; CI, confidence interval; RES, ridaforolimus-eluting stent; TLF, target lesion failure; and ZES, zotarolimus-eluting stent.
