Fig. 2.
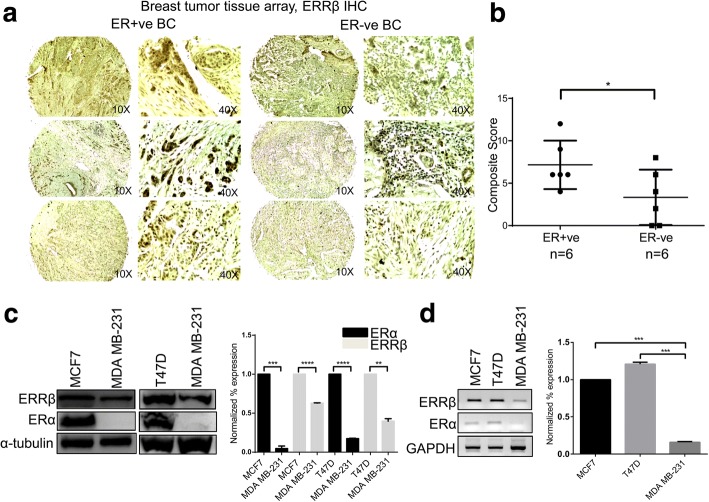
Correlation of ERRβ expression with ERα in breast tumors and cell lines. a Immunohistochemical staining with ERRβ antibody in ER + ve and ER-ve breast cancer patients. Elevated expression of ERRβ was found in ER + ve (n = 6) compared to ER-ve (n = 6) breast cancer patient samples. b Graphical representation of IHC composite scores of each tissue microarray sample showing significant elevated expression of ERRβ in ER + ve than in ER-ve breast cancer patient samples. Graph was plotted using composite score and p-values were calculated using 2-group t-test (p < 0.05 considered as significant). c, d Western blots, Reverse transcription polymerase chain reaction (RT PCR) and densitometry analysis results representing elevated levels of ERRβ in ER + ve breast cancer cells (*p < 0.05, **p < 0.01, ***p < 0.001, ****p < 0.0001). Statistical significance for relative gene expression (RT PCR) and normalized percentage of expression (WB) was analyzed using One-way ANOVA and unpaired t-test respectively (p-value < 0.05 was considered as significant)

