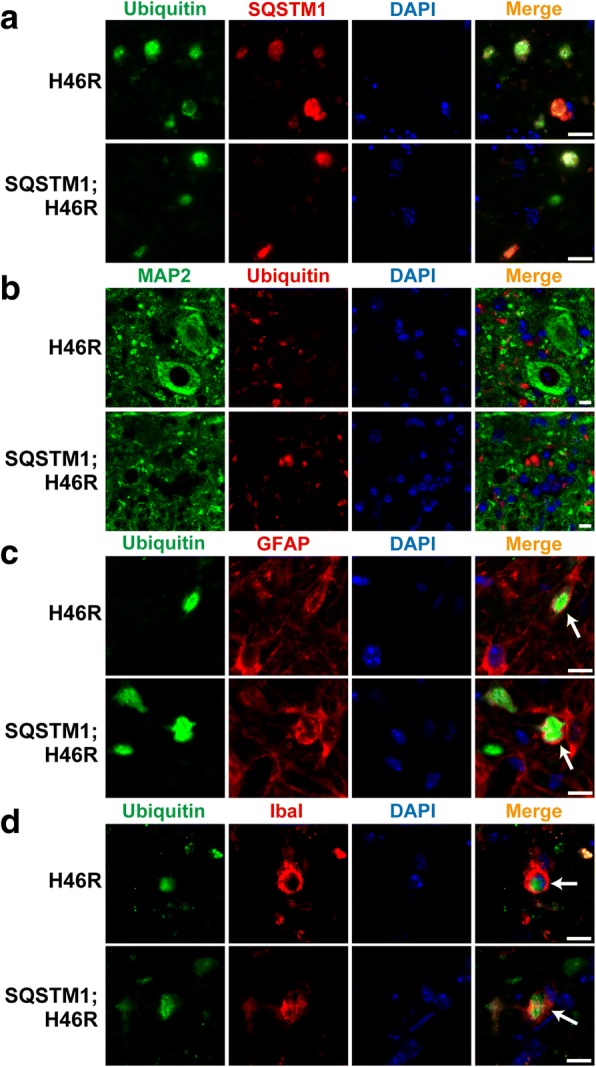
Fig. 5.

High-magnification images for the distribution of ubiquitin-positive aggregates in the spinal cord from SOD1H46R-expressing mice. a-d Representative images of double immunostaining with Ubiquitin (green) and SQSTM1 (red) (a), MAP2 (green; neuron marker) and Ubiquitin (red) (b), Ubiquitin (green) and GFAP (red; astrocyte marker) (c), Ubiquitin (green) and Iba1 (red; microglia marker) (d) in the lumbar cord (L4–5) from SOD1H46R (H46R) and SQSTM1;SOD1H46R (SQSTM1;H46R) mice at end-stage. The nuclei were counterstained with DAPI (blue). Scale bars = 10 μm. c Arrows indicate that ubiquitin-positive aggregates are present in GFAP-positive astrocytes. d Arrows indicate that ubiquitin-positive aggregates are surrounded by microglia
