Fig. 8.
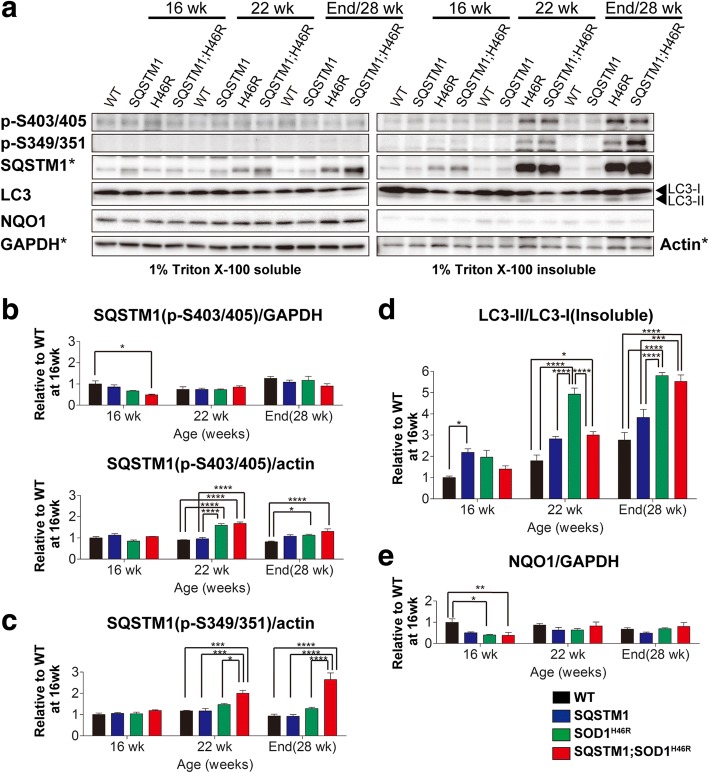
Accumulation of phosphorylated SQSTM1 in the spinal cord of SOD1H46R-expressing mice. a Western blot analysis of Ser403(human)/Ser405(mouse)-phosphorylated SQSTM1 (p-S403/405), Ser349(human)/Ser351(mouse)-phosphorylated SQSTM1 (p-S349/351), LC3, and NQO1 in the spinal cord from mice with four different genotypes; wild-type (WT), SQSTM1 (SQSTM1), SOD1H46R (H46R), and SQSTM1;SOD1H46R (SQSTM1;H46R) mice at 16 weeks of age (wk), 22 wk., and end-stage (H46R and SQSTM1;H46R) or 28 wk. (WT and SQSTM1). Two fractions; 1% Triton X-100 soluble and 1% Triton X-100 insoluble/5%SDS soluble fractions were analyzed. GAPDH and β-actin (Actin) were used for a loading control in Triton X-100-soluble and -insoluble fractions, respectively. To properly compare the intensities of signals between phosphorylated SQSTM1 and total SQSTM1, the results from same blots for SQSTM1 in Fig. 7a, GAPDH, and Actin (asterisks) in Fig. 6a are used again as references. b Quantification of 1% Triton X-100 soluble and insoluble S403/S405-phosphorylated SQSTM1. c Quantification of insoluble S349/S351-phosphorylated SQSTM1. d Quantification of the LC3-II to LC3-I ratio (LC3-II/LC3-I) in insoluble fraction. e Quantification of soluble NQO1. b-e Values are mean ± s.e.m. (n = 4) in an arbitrary unit relative to WT mice at 16 weeks of age. Signal intensities were normalized by the levels of GAPDH (soluble fractions) and Actin (insoluble fractions). Statistical significance was evaluated by two-way ANOVA with Bonferroni’s post hoc test (comparisons between different genotypes in the same age; *p < 0.05, **p < 0.01, ***p < 0.001, ****p < 0.0001)

