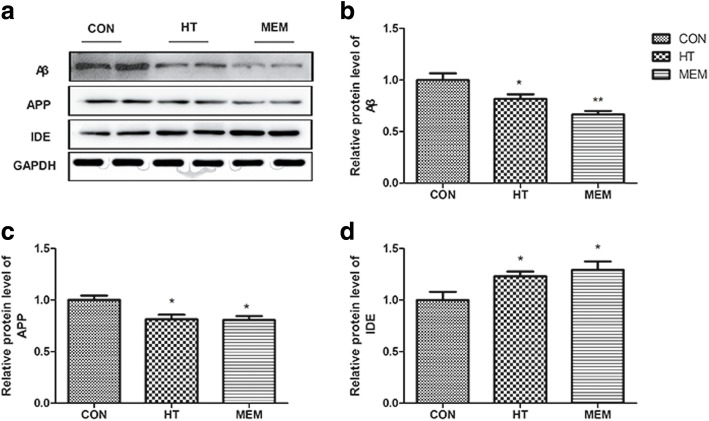
Fig. 7.
HT reduced APP expression and upregulated IDE expression in the brains of APP/PS1 mice. a The protein levels of Aβ, APP and IDE were measured by Western blotting in the different groups. b Quantitative analysis of Aβ expression. *P < 0.05 versus control group. c Quantitative analysis of APP expression. *P < 0.05 versus control group. d Quantitative analysis of IDE expression. *P < 0.05 versus control group, n = 6 per group

