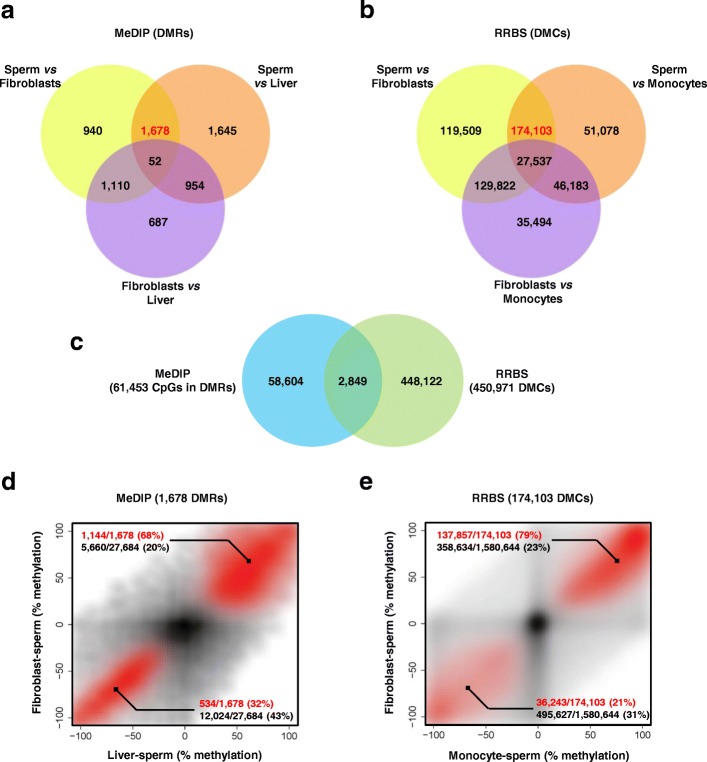
Fig. 3.
Two distinct sets of differentially methylated regions and differentially methylated CpGs display undermethylation in sperm. a Venn diagram showing the DMRs identified using MeDIP-chip in sperm, fibroblasts and liver. A total of 1678 DMRs specific to the comparison between sperm and somatic cells was obtained (in red). b Venn diagram showing the DMCs identified using RRBS in sperm, fibroblasts and monocytes. A total of 174,103 DMCs specific to the comparison between sperm and somatic cells was obtained (in red). c The CpG positions included in the 3780 DMRs identified between sperm and fibroblasts using MeDIP were extracted. The Venn diagram shows the intersection between these CpGs and the 450,971 DMCs identified between sperm and fibroblasts using RRBS. d, e Scatterplots showing the methylation differences between two somatic tissues and sperm, for all regions or CpGs used during differential analysis (in black; background) and for DMRs/DMCs specific to the comparison between sperm and somatic cells (in red). The proportions of background regions/CpGs overmethylated (upper right edge) and undermethylated (lower left edge) in both somatic tissues compared to sperm are indicated in black. The proportions of DMRs/DMCs overmethylated and undermethylated in both somatic tissues compared to sperm are indicated in red. d Differences in methylation between liver and sperm (Prliver - Prsperm; x-axis) and between fibroblasts and sperm (Prfibroblasts - Prsperm; y-axis) for regions and DMRs identified using MeDIP (see Additional file 1: Supplementary methods for the definition of Prsperm, Prliver and Prfibroblasts). e Differences in methylation between monocytes and sperm (x-axis) and between fibroblasts and sperm (y-axis) for CpGs and DMCs identified using RRBS

