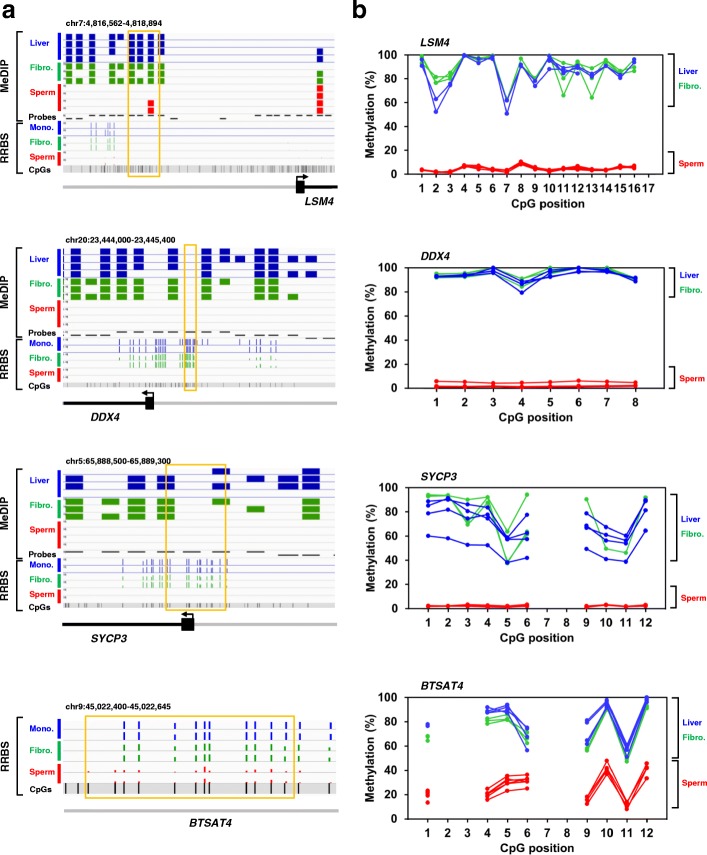
Fig. 6.
Validation by bisulfite-pyrosequencing. a IGV browser views of the gene regions targeted for pyrosequencing. In the MeDIP-chip panels, the “Probes” track indicates the probe positions on the microarray. The blue, green, and red bar charts represent probes with signal enrichment in the MeDIP fraction for liver, fibroblast and sperm samples, respectively. An absence of chart at a given probe position denotes that signal was not enriched in the MeDIP fraction. In the RRBS panels, the blue, green, and red bar charts represent the methylation percentages at each CpG 5-500 position for monocyte, fibroblast and sperm samples, respectively. Individual CpGs are shown, as are the MeDIP probe classes based on CpG frequency (the upper, middle and lower bands represent high, intermediate and low class probes, respectively). The orange boxes delineate the regions analyzed by pyrosequencing. b Methylation percentages of the CpGs assayed by pyrosequencing in sperm (n = 6), fibroblasts (n = 3) and liver (n = 4). The difference between sperm and somatic cells is significant at every position (p < 0.05, permutation test)

