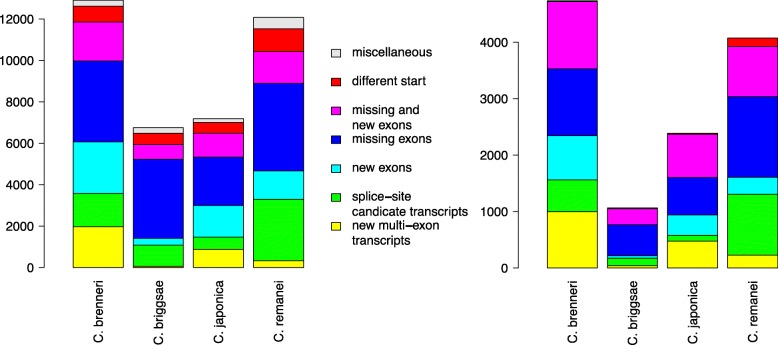
Fig. 4.
Summary of difference for GeMoMa predictions with tie =1. The relaxed evaluation (left panel) depicts differences between GeMoMa predictions and annotation without any filter on the annotation, while the conservative evaluation (right panel) applies additional filters for the annotation (cf. main text). Predictions that do not overlap with any annotated CDS are depicted in yellow, predictions that differ from annotated CDSs only in splice sites are depicted in green, predictions that have additional exons compared to annotated CDSs are depicted in turquoise, predictions that missed some exons compared to annotated CDSs are depicted in blue, predictions with additional and missing exons compared to annotated CDSs are depicted in pink, predictions that only differ in the start of the CDS compared to annotated CDS are depicted in red, and any other category is depicted in gray

