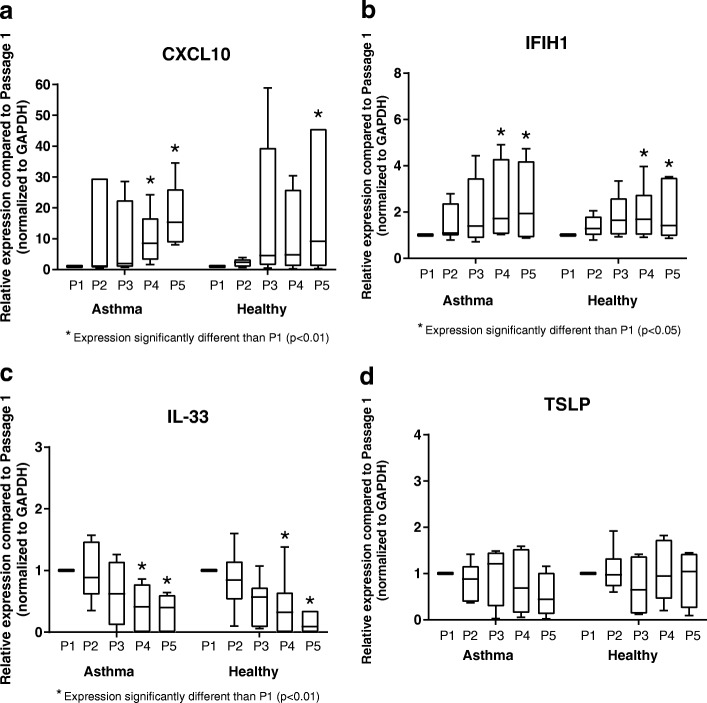
Fig. 3.
Expression of innate immunity and immunomodulatory genes by primary BECs. Expression of CXCL10 (a), IFIH1 (b), IL-33 (c), and TSLP (d) by BECs at P1 (n = 6 asthma donors, n = 6 healthy donors), P2 (n = 6 asthma donors, n = 6 healthy donors), P3 (n = 4 asthma donors, n = 6 healthy donors), P4 (n = 6 asthma donors, n = 6 healthy donors), and P5 (n = 6 asthma donors, n = 6 healthy donors) are presented as box-and-whisker plots which depict the interquartile range and median (the ends of each box represent the upper and lower quartiles, error bars represent the maximum and minimum, and the horizontal line within the box represents the median). To compare expression of genes at P2-P5 to expression at P1, and to compare patterns of gene expression between asthmatic and healthy donors, ordinary two-way ANOVA with Dunnett’s multiple comparisons test was used for normally distributed data, and Kruskal-Wallis ANOVA with Dunn’s multiple comparisons test was used for non-normally distributed data

