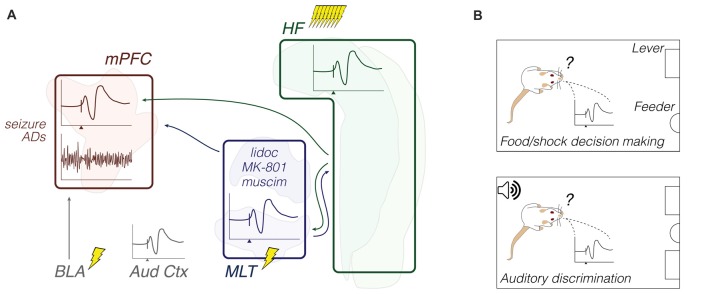
Figure 3.
Synaptic plasticity: methods and objects of study merged into a schematic summary. The figure portrays generic representations of techniques reviewed in the “Synaptic plasticity” subsection. Arrows from the HF are generically positioned, i.e., no distinction is made between dorsal, intermediate and ventral domains. Outlines of brain areas are based on Figure 1. (A) In vivo electrophysiology, intracerebral electrical stimulation, and pharmacological manipulations. Experiments evaluated the prefrontal and auditory cortical field potential reactivity to afferent electrical stimuli or sound stimuli, including during drug effects and after induction of synaptic plasticity or seizure activity. Lightning icons represent single electrical pulses, or trains of pulses. Representative prefrontal cortical voltage traces: evoked (top) and spontaneous field potentials (bottom), with the x-axis arrowhead representing afferent stimuli (e.g., Hugues and Garcia, 2007; Kiss et al., 2011b). Field potential responses recorded from other brain sites are also illustrated (e.g., Grupe et al., 2014). (B) Chronic electrophysiology (field potential responses) during a food vs. trigeminal shock operant task (top), and a two-lever auditory discrimination task (bottom). Experiments evaluated relationships between behavioral performance and evoked field potential responses (e.g., López-Ramos et al., 2015). Abbreviations: ADs, after-discharges; Aud Ctx, auditory cortex; BLA, basolateral amygdala; HF, hippocampal formation; lidoc, lidocaine; MLT, midline/paramidline thalamus; mPFC, medial prefrontal cortex; muscim, muscimol.

