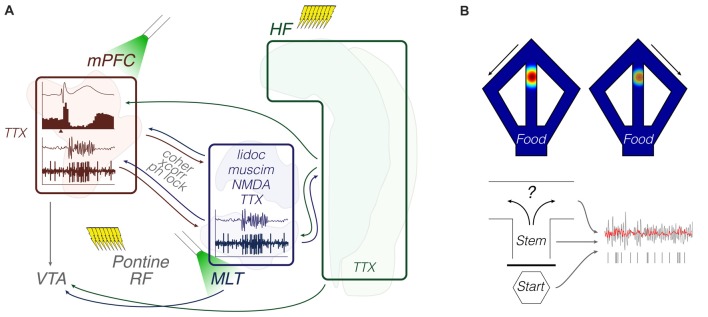
Figure 4.
Functional coupling: methods and objects of study merged into a schematic summary. The figure portrays generic representations of techniques reviewed in the “Functional coupling” subsection. Arrows from the HF are generically positioned, i.e., no distinction is made between dorsal, intermediate and ventral domains. Outlines of brain areas are based on Figure 1. (A) In vivo electrophysiology, intracerebral electrical/optical perturbation and pharmacological manipulations. Experiments evaluated response evoking and circuit connectivity through intra-cerebral drugs and afferent stimulation, including optogenetic terminal inhibition. Lightning icons represent trains of pulses. The beam icon represents intracerebral green light pulses for activation of archaerhodopsins, including on presynaptic terminals. Representative prefrontal cortical data: field potential response with corresponding perievent firing histogram (top; x-axis arrowhead representing afferent stimuli), and theta-filtered voltage trace with corresponding multi-unit activity (bottom; e.g., Hartung et al., 2016; Padilla-Coreano et al., 2016; Bueno-Junior et al., 2018). The latter is also illustrated in the MLT. (B) Chronic electrophysiology and representative activity patterns during maze performance. Top: place-cell and trajectory-dependent firing. Bottom: illustrative single-unit entrainment to raw (gray) and filtered (red) field oscillations depending on the maze location or trial phase (e.g., Ito et al., 2015; Hallock et al., 2016; Bolkan et al., 2017). Abbreviations: coher, coherence; HF, hippocampal formation; lidoc, lidocaine; mPFC, medial prefrontal cortex; MLT, midline/paramidline thalamus; muscim, muscimol; ph lock, phase locking; RF, reticular formation; TTX, tetrodotoxin; VTA, ventral tegmental area; xcorr, crosscorrelation.

