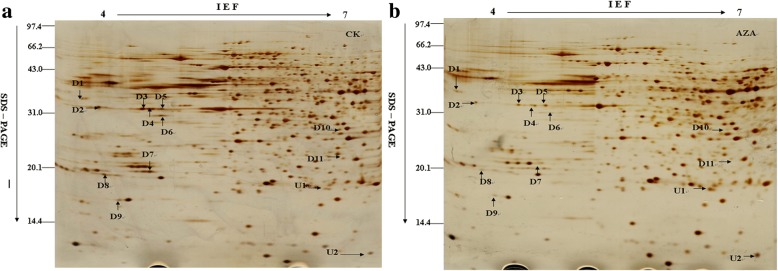
Fig. 2.
The two-dimensional electrophoresis images of azadirachtin-treated Sf9 cells. a 2-DE gel of control sample. b 2-DE gel of the sample treated with 0.75 μg/mL azadirachtin for 24 h. Arrows indicate the differentially expressed protein spots, which were designated as D1–D11 and U1, U2. Among them, spots D1-D11 are down-regulated and spots U1and U2 are up-regulated

