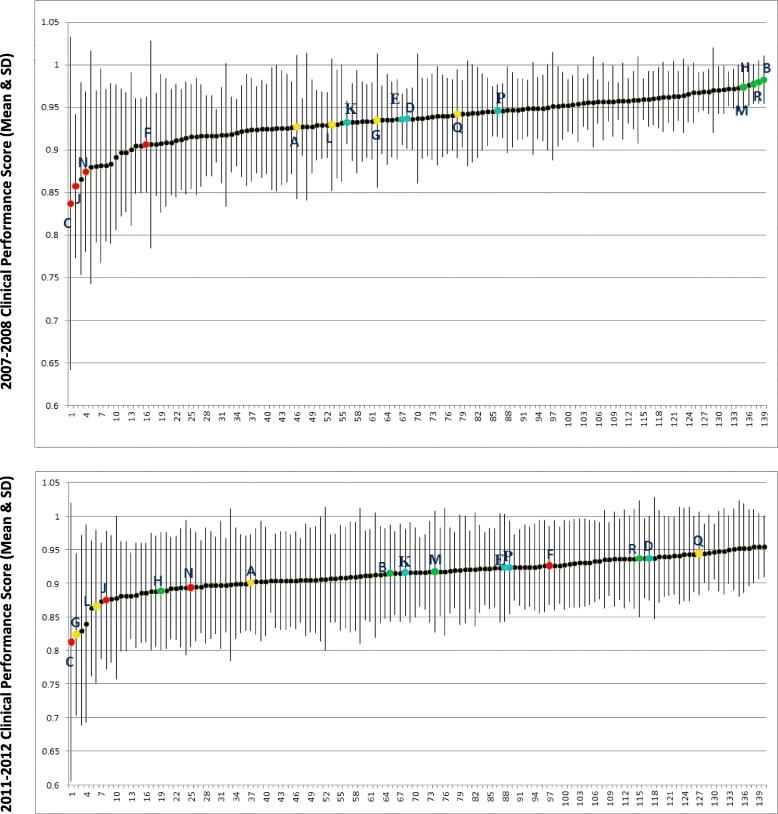
Fig. 1.
Mean clinical performance scores and standard deviations for all VA Medical Centers in 2007–2008 vs. 2011–2012. Note: colored points represent four performance categories of 16 sites used in this study: red = low, yellow = highly variable, blue = consistently moderate, green = high. In both graphs, the colors represent the category assignments the sites received in 2008 to show the extent to which their relative positions may have changed in 2012

