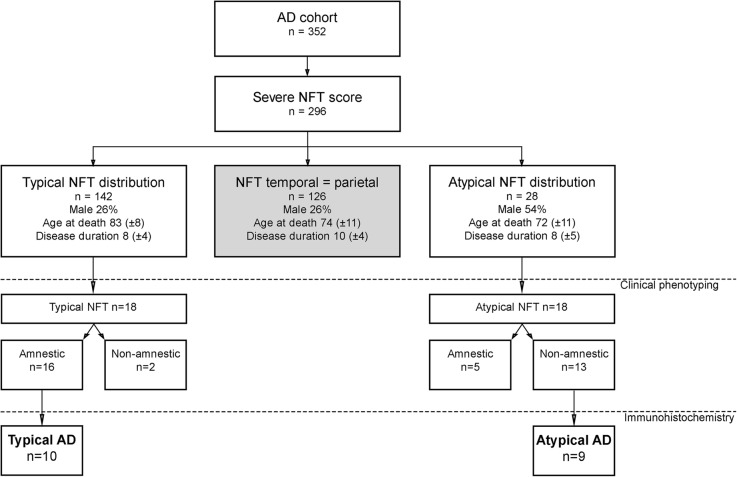
Fig. 1.
Flowchart of neuropathologically assessed and semi-quantitatively scored AD cohort. Between 1996 and 2014, 352 AD cases came to autopsy and were semi-quantitatively scored for NFTs as described by Hoogendijk et al. [27]. In 296 cases, an NFT score of ≥ 3 in the temporal and/or parietal cortex was observed. Typical NFT distribution was defined as a higher NFT score in the temporal compared to the parietal cortex. Atypical NFT distribution was defined as a higher NFT score in the parietal compared to the temporal section. From the cases with typical and atypical NFT distribution, 18 cases per group were selected for which the clinical phenotype was stratified as either amnestic or non-amnestic (results shown in Table 2). From these clinical phenotyped cases, 9 cases with an atypical NFT as well as non-amnestic clinical presentation were compared with 10 cases with an amnestic presentation and typical NFT distribution using immunohistochemistry. Mean ± SD is shown for age at death and disease duration in years. AD Alzheimer’s disease, NFT neurofibrillary tangle

