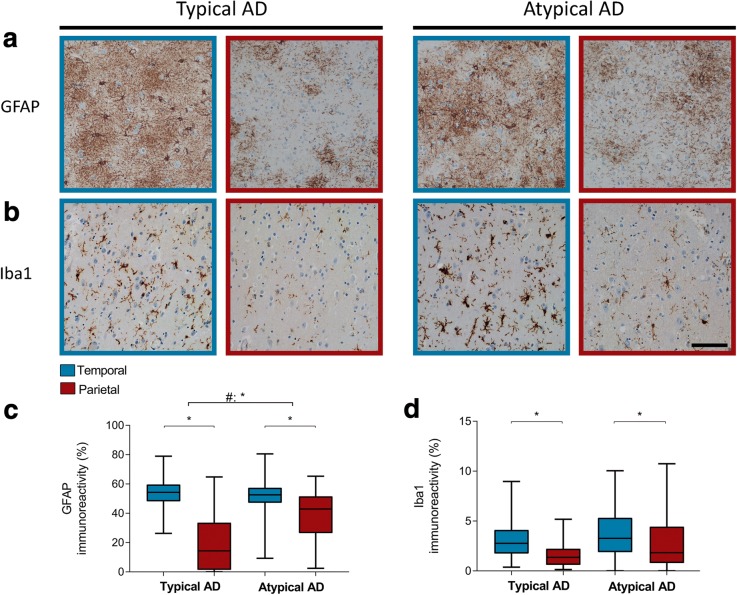
Fig. 3.
GFAP and Iba1 immunoreactivity is temporal dominant in both AD phenotypes. a, b The temporal cortex (blue border) shows more GFAP and Iba1 immunoreactivity respectively than the parietal cortex (burgundy border) in typical and atypical AD. Bar represents 100 μm. c, d Boxplot showing GFAP and Iba1 immunoreactive area (%) in the temporal and parietal section, respectively, of both AD phenotypes. Atypical AD shows relatively more GFAP immunoreactivity in the parietal cortex than typical AD (Table 5). Iba1 distribution is not different between the two phenotypes. Data shown as median (bar), 1st and 3rd quartile (box boundaries), and min to max (error bars). *p < .0045

