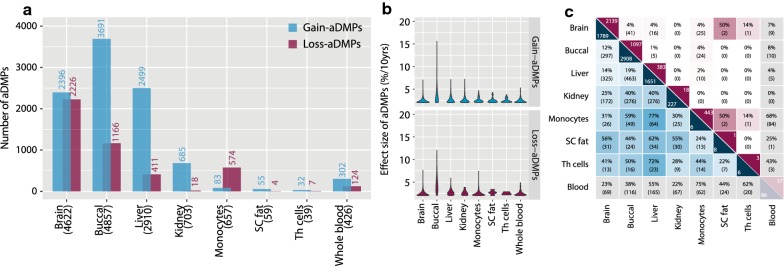
Fig. 2.
Identification of aDMPs. a Number of identified gain- and loss-aDMPs (y axis) in this study for each tissue (x axis). b Slopes of identified gain- and loss-aDMPs (y axis) for each tissue (x axis). c Overlap between tissues in identified gain- and loss-aDMPs. In the diagonal cells the number of aDMPs unique for that tissue, the upper number represents the percentage, the lower number the number of overlapping aDMPs. Blue—gain-aDMPs; Purple—loss-aDMPs

