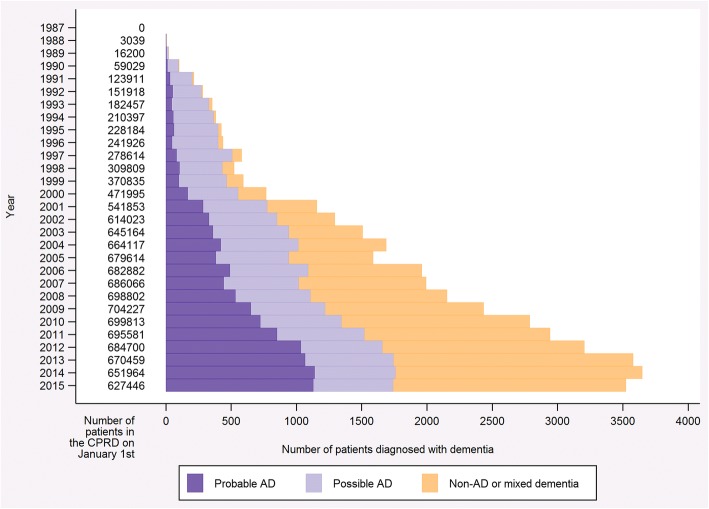
Fig. 1.
Bar graph illustrating the number of patients diagnosed with dementia, by diagnosis type. The data presented are restricted to patients who received a diagnosis prior to 1st January 2016 and are from an English practice with a last data collection date in 2016 to reflect the main analysis. Definitions for each of the diagnoses are presented in Table 3.

