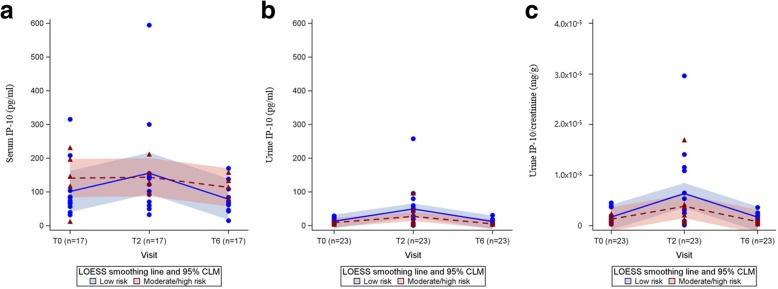
Fig. 3.
Longitudinal analysis of IP-10 levels in patients with active TB stratified by risk of relapse. Longitudinal (a) serum, (b) urine IP-10, and (c) urine IP-10/creatinine ratio obtained throughout treatment (T0, T2, and T6) were analysed in risk subgroups (low-risk and moderate/ high-risk groups) using locally weighted scatterplot smoothing (LOESS) and confidence intervals of the mean (CLM)

