Fig. 4.
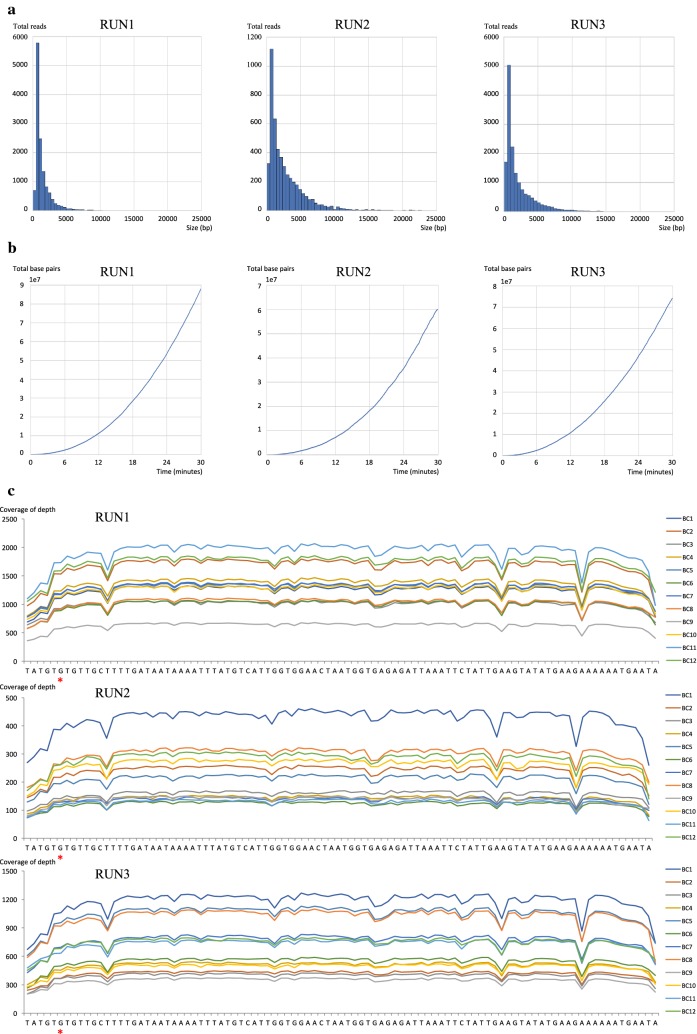
The results of FAST5 reads analysis collected 30 min from the start of MinION sequencing. a Histogram of FAST5 read sizes from each MinION sequencing run. b Collector’s curve reflecting the total base pairs of sequencing yield over time for each MinION sequencing run. c Depth of coverage for each ONT-barcode number and MinION sequencing run

