
Fig. 6.
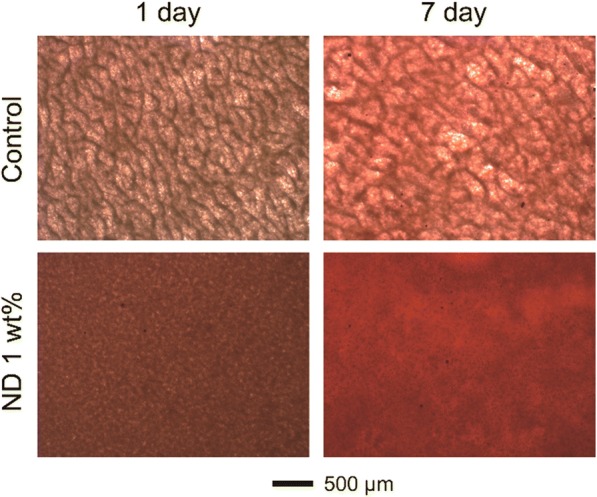
Representative optical images of the cell/fibrous matrices cultured on the PCL (control) and ND/PCL fibrous matrices (1 wt% ND concentration) for 1 and 7 days, followed by Alizarin Red S staining
Official websites use .gov
A
.gov website belongs to an official
government organization in the United States.
Secure .gov websites use HTTPS
A lock (
) or https:// means you've safely
connected to the .gov website. Share sensitive
information only on official, secure websites.
Representative optical images of the cell/fibrous matrices cultured on the PCL (control) and ND/PCL fibrous matrices (1 wt% ND concentration) for 1 and 7 days, followed by Alizarin Red S staining