Fig. 2.
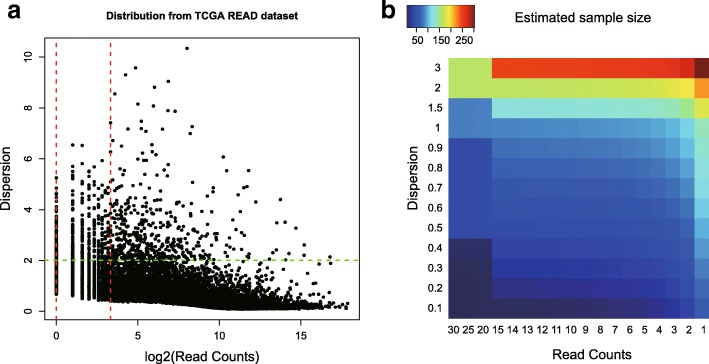
Read counts and dispersion distribution greatly influence the estimated sample size and power. a The read counts and dispersion distribution for all genes from TCGA Rectum adenocarcinoma (READ) dataset. The red lines indicate read counts equal to one and 10. And the green line indicates the 95% quantile of all gene dispersions. b The estimated sample size required to achieve 0.8 power in different combinations of read counts and dispersions

