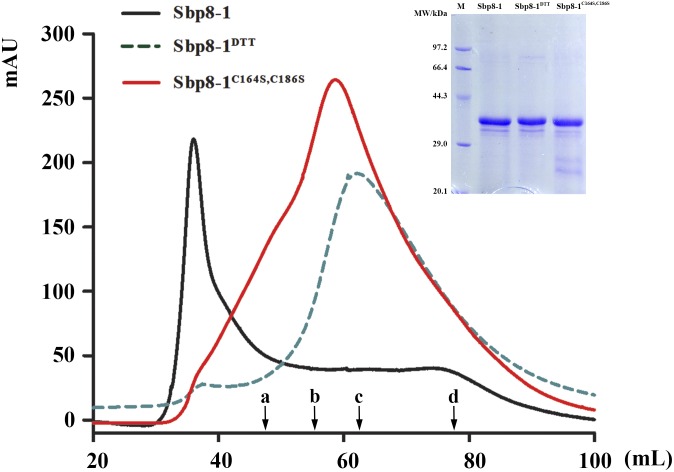
FIGURE 5.
Protein polymerization analysis based on gel filtration. The Sephacryl S-200 High Resolution column was used to evaluate the polymerization state. The solid black line represented the gel-filtration profile of Sbp8-1 running in the binding buffer and the dashed black line represented gel filtration profile of Sbp8-1 running with binding buffer with 10 mM DTT, while the solid red line represented the gel-filtration profile of Sbp8-1C164S,C186S. The inset SDS–PAGE shows the purity of each sample. The black arrows indicate the elution volume at the peak of different molecular weight proteins. a, IgG (160 kDa); b, BSA (67 kDa); c, β-lactoglobulin (35 kDa); d, cytochrome C (12.4 kDa).

